Friday, December 30, 2016

Advanced Analytics: Calculate Attribute Importance using Custom R-Scripts on OracleDV

Resources: OracleBI Public Store , Boruta Documentation , Boruta in Action

Attribute Importance is a method that identifies and ranks the attributes that are most important in predicting a target attribute or in understanding the degree of influence of an attribute on the target attribute. For example in a typical customer satisfaction study customers are asked to provide ratings on individual attributes followed by a rating on overall Satisfaction. Customers do not give equal weightage to all attributes and some factors influence the ratings more than others. So marketers need to identify which of these individual attributes are rated more by customers to so that can focus their limited resources on improving the customer satisfaction for that attribute. In such scenarios Attribute Importance method comes to the rescue of Marketers.

In this blog we will discuss a way to calculate the attribute importance on OracleDV using a custom R-Script. This R-Script along with a sample DV project can be downloaded from Oracle BI Public Store. For the purpose of demonstration we have taken a dataset which contains the factors along with metric values that contribute to diabetes. We will take this dataset and identify the importance of each of these attributes in causing diabetes. This R-Script is quite easy to deploy and can be used for many other datasets. This R-Script uses Boruta R package, which  can be downloaded from CRAN repository. Boruta follows an all-relavant feature selection method. This method captures all features which are in some circumstances relavant to the outcome variable.

How does this Script work:This scripts calculates Importance of Attribute Columns(numerical/categorical) in determining values of Target column. Boruta R uses all-relavant feature selection method. This method is performed using multiple iterations; summary of scores obtained by each column in these iterations are returned along with the Decision if the column should be considered important in determining values of Target Column("Confirmed") or not("Rejected"). For more information on the Boruta Package please refer to the Boruta Documentation. For detailed explanation on usage of Boruta R package using an example, please refer to this link: Boruta in Action.

Inputs: This script needs a RecId column, a Target column based on which we will compute Importance of Attribute columns and Attribute columns. Attribute columns can be numerical or categorical
Optional Input: ColNameList : By default script assigns Column1, Column2, Column3 etc as names to the input columns and as a result in output of "ColumnName" column we will see the same names. However to see actual column names in output, pass the actual column names as optional input parameter to the script in a comma seperated format, for ex: "pregnant,diabetes,age.."

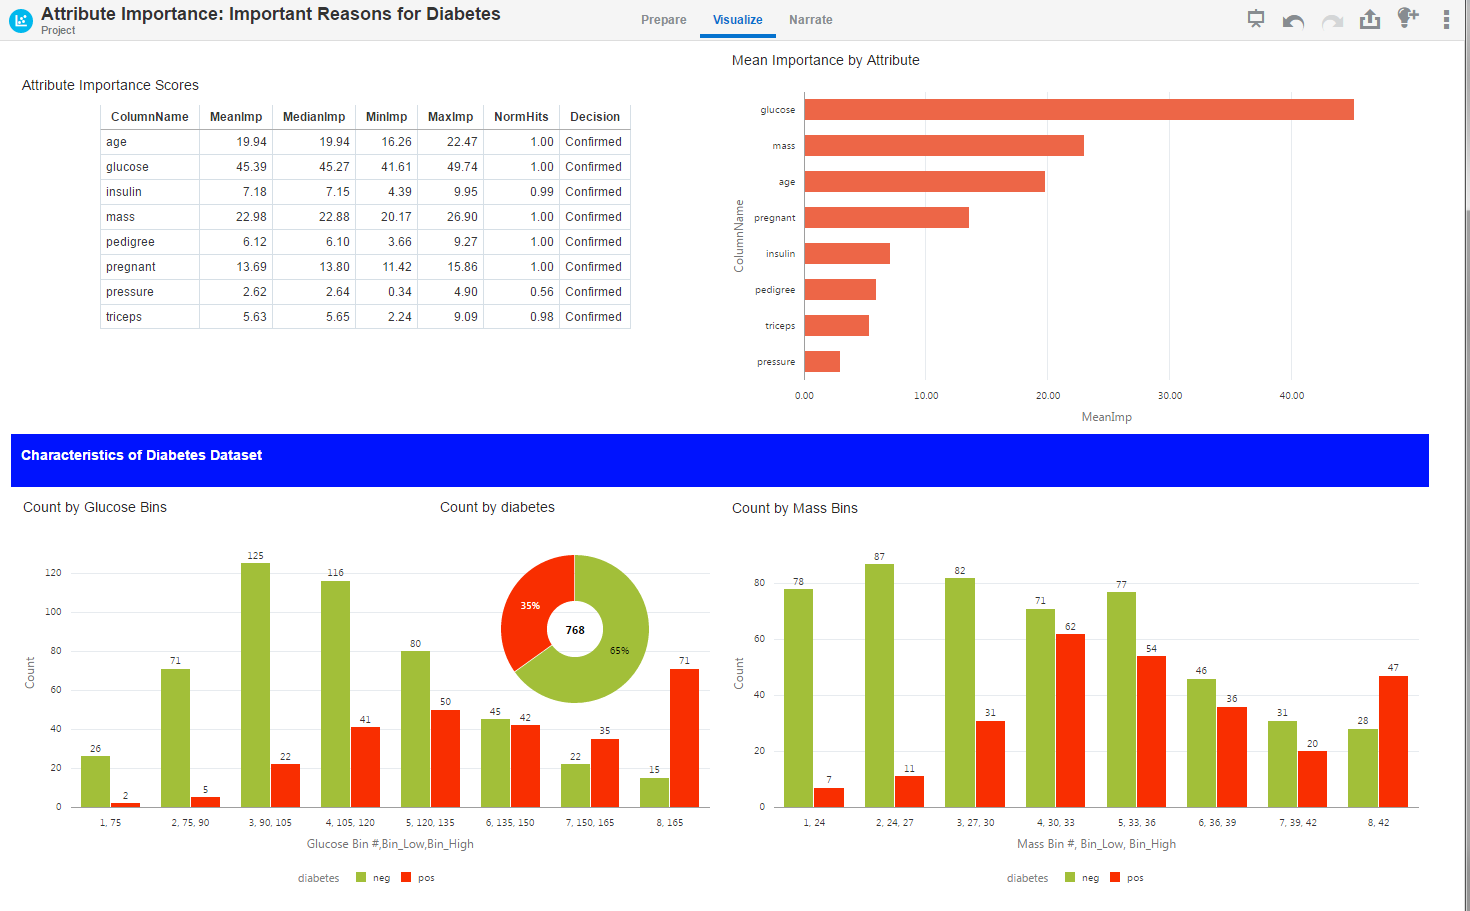
Output: This script returns Attribute Importance score of each column in determining the values of Target column along with column names passed as optional input.
   ColumnName: Name of the Column
MeanImp   : Mean of the Importance score computed over multiple iterations.
MedianImp : Median of the Importance score computed over multiple iterations.
MinImp    : Minimum of the Importance score computed over multiple iterations.
MaxImp    : Maximum of the Importance score computed over multiple iterations.
NormHits  : Number of hits normalised to number of importance source runs
   Decision  : "Confirmed" : Column can be considered Important ; "Rejected" : Column has very low importance score and can be neglected

Following are the steps to deploy this R-Script in your local OracleDV:

1) Install Advanced Analytics feature in Oracle DV by clicking on the below icon. This will install Oracle R deployment. Alternatively you can install Advanced Analytics by running install_advanced_analytics.cmd present in <DV_INSTALL_DIRECTORY>


2) If not installed Boruta R-Package already, please install it using following instructions
    Open R console(double click Rgui.exe present in <Advanced_Analytics_Install_Dir>\bin\x64) and
    install Boruta Package.
    Following are the R commands to install:
     Set Proxy:
        $ Sys.setenv(http_proxy="http://<your_proxy_host>:<port>")
           set proxy appropriate to your network settings.
     Install Package:
        $ install.packages("Boruta")
3) Download Attribute_Importance_V1.zip from OracleBI Public Store and unzip it.
4) Copy R.AttributeImportance.xml to <DV_INSTALL_DIRECTORY>\OracleBI1\bifoundation\advanced_analytics\script_repository
5) Import the .dva project to Oracle DV. Password for the .dva is Admin123

Here is a snapshot:


Are you an Oracle Analytics customer or user?

We want to hear your story!

Please voice your experience and provide feedback with a quick product review for Oracle Analytics Cloud!
 

Tuesday, December 20, 2016

Row Expander plugin for drill up/drill down in Oracle Data Visualization


A Row Expander Custom Visualization plugin for Oracle DV Desktop is available on Oracle BI Public Store. This plugin deploys on Oracle DV Desktop in a few minutes and enables a fully interactive drill up/drill down hierarchy experience. 

The plugin accommodates multiple attributes that may or may not belong to a hierarchy, and supports multiple additive metrics in the drilling behavior. 

This first version of the plugin only addresses additive measures (sum), and may hit a limitation in number of rows returned. This limitation will disappear with upcoming builds of DV Desktop. 

The following video highlights the experience of this plugin. 


Are you an Oracle Analytics customer or user?

We want to hear your story!

Please voice your experience and provide feedback with a quick product review for Oracle Analytics Cloud!
       

Monday, December 19, 2016

Advanced Analytics: Association Rule Mining on OracleDV using Custom R-Scripts

Association Rule Mining is a common technique used to find associations between many variables. It is intended to identify strong rules existing in data using some measures of interestingness. It is often used by grocery stores to perform Market Basket Analysis(MBA), and used by online stores to provide suggestions for purchases. 

Do you have a transactional detaset with you and would like to perform Association Rule Mining on it? You can do it very easily on OracleDV using Rule mining Custom R-Script. The R-script returns association rules in a tabular format with Support, Confidence and Lift associated with each rule. This list of association rules can also be exported/downloaded to excel format. You can also use the script in Dataflows by saving the Rule set generated from your data and consume it as a source in the dataflow. In this blog we will discuss how you can deploy this R-Script and perform Rule Mining on OracleDV Desktop.

Steps to deploy:

1) Install Advanced Analytics feature in Oracle DV by clicking on the below icon. This will install Oracle R deployment. Alternatively you can install Advanced Analytics by running install_advanced_analytics.cmd present in <DV_INSTALL_DIRECTORY>


2) If not installed arules R-Package already, please install it using following instructions
    Open R console(double click Rgui.exe present in <Advanced_Analytics_Install_Dir>\bin\x64) and
    install arules Package.
    Following are the R commands to install:
     Set Proxy:
        $ Sys.setenv(http_proxy="<your_proxy_host>:<port_number>")
           set proxy appropriate to your network config.
     Install Package:
        $ install.packages("arules")

3) Download Association_Rule_Mining_V1.zip from OracleBI Public Store and unzip it.
4) Copy R.RuleMining.xml to <DV_INSTALL_DIRECTORY>\OracleBI1\bifoundation\advanced_analytics\script_repository
5) Import the .dva project to Oracle DV. Password for the .dva is Admin123

Here is a snapshot:

Are you an Oracle Analytics customer or user?

We want to hear your story!

Please voice your experience and provide feedback with a quick product review for Oracle Analytics Cloud!
 

Advanced Analytics: Missing Data? Fret no more, fill in the Missing Data on Oracle DV using R

More often than not, we find data missing in our data sources. And how do we deal with it? we either remove that data or fill it manually. But these methods have a serious implication of skewing your data and giving you wrong insights leading to flawed analysis. No more of this manual guessing or hunch based substitutions or elimination of missing data on OracleDV. You can impute(fill) the missing data in your analysis using Predictive Analytics Algorithms using this Custom R-Script. This R-Scripts uses imputation algorithms present in R data imputation packages like MICE and Hmisc.

And it is quite easy to deploy this data imputation R-Scripts in your local machine. This technique can be used in Dataflows quite easily. The R-script returns the imputed data in a tabular format which can be saved as datasource in DV or can be exported/downloaded to an excel sheet and this excel sheet can be used in Dataflows. Here are the steps to install deploy this R Script in your OracleDV:

1) Install Advanced Analytics feature in Oracle DV by clicking on the below icon. This will install Oracle R deployment. Alternatively you can install Advanced Analytics by running install_advanced_analytics.cmd present in <DV_INSTALL_DIRECTORY>


2) If not installed Mice, Hmisc R-Packages already, please install them using following instructions
    Open R console(double click Rgui.exe present in <Advanced_Analytics_Install_Dir>\bin\x64) and
    install MICE,Hmisc Packages.
    Following are the R commands to install:
     Set Proxy:
        $ Sys.setenv(http_proxy="http://<your_proxy_host>:<port>")
           set proxy appropriate to your network settings.
     Install Package:
        $ install.packages("mice")
        $ install.packages("Hmisc")
3) Download Data_Imputation_V1.zip from OracleBI Public Store and unzip it.
4) Copy R.ImputeValues.xml to <DV_INSTALL_DIRECTORY>\OracleBI1\bifoundation\advanced_analytics\script_repository
5) Import the .dva project to Oracle DV. Password for the .dva is Admin123

Here is a snapshot:


Are you an Oracle Analytics customer or user?

We want to hear your story!

Please voice your experience and provide feedback with a quick product review for Oracle Analytics Cloud!
 

Advanced Analytics: Perform Sentiment Analytics on DV using Custom R Scripts

In this blog we will discuss how to perform Sentiment Analysis on Oracle DV on textual data like, Product reviews, customer feedback and social media posts etc. It is well known that OracleDV supports R-Integration and allows users to run their Custom R-scripts. This integration is quite versatile and powerful because Oracle DV allows users to fetch results from R-Scripts in a tabular format and mash it up with data sources. In this example Sentiment Analysis is implemented using a custom R-Script which returns the tonality of the textual data. This example can be downloaded from Oracle BI Public Store.

The R-Script takes textual data as input and categorizes input into 6 categories based on tonality of the data: Very Positive, Positive, Neutral, Negative, Very Negative and Sarcasm. This tonality information can be mashed up with your source data to gain further insights. In Dataflows, you can enrich the data with sentiment information returned by the R-script. Results returned by the R-script can also be downloaded/exported to excel sheets, which can then be used in Dataflows.

Following are the steps to deploy this example in OracleDV desktop:

1) Install Advanced Analytics feature in Oracle DV by clicking on the below icon. This will install Oracle R deployment. Alternatively you can install Advanced Analytics by running install_advanced_analytics.cmd present in <DV_INSTALL_DIRECTORY>


2) If not installed RSentiment Package already, please install it using following instructions
    Open R console(double click Rgui.exe present in <Advanced_Analytics_Install_Dir>\bin\x64),
    install arules Package. Following are the R-commands to install:
     Set Proxy:
        $ Sys.setenv(http_proxy="<your_proxy_host>:<port_number>")
           set proxy appropriate to your network config.
     Install Package(updated instructions):
        $ install.packages("http://cran.r-project.org/src/contrib/Archive/RSentiment/RSentiment_1.0.4.tar.gz",repos=NULL, type="source")
3) Download Sentiment_Analysis_V1.zip from OracleBI Public Store and unzip it.
4) Copy R.Sentiment.xml to <DV_INSTALL_DIRECTORY>\OracleBI1\bifoundation\advanced_analytics\script_repository
5) Import the .dva project to Oracle DV. Password for the .dva is Admin123

Here is a snapshot:


Are you an Oracle Analytics customer or user?

We want to hear your story!

Please voice your experience and provide feedback with a quick product review for Oracle Analytics Cloud!


Advanced Analytics: R Term Frequency Analysis on OracleDV

In this blog we will discuss how to perform Term Frequency Analysis on Oracle DV using R. What is Term Frequency Analysis(TFA)? TFA is a technique which takes Textual data as input and counts how many times each word is repeated in the textual data. Will it count frequency of each and every distinct word in the text? Yes, it does. But it also provides users option to filter out common words, which do not actually add any meaning like (and, like etc), these words are called stop words. TFA can filter out these stop words and make your analysis more meaningful. TFA has many applications and most common among them are: to analyse the quality of web pages, to identify key highlights in online reviews/posts and to identify popularity of a particular brand or product in social media posts.

It is well known that OracleDV supports R-Integration and allows users to run Custom R-scripts on Oracle DV. Term Frequency Analysis is implemented using Custom R-Script. And it is quite easy to deploy Term Frequency Analysis R Cartridge on your DV. Just download from OracleBI Public store, deploy it and get going with your analysis. You can also use the R-script in Dataflows and perform analysis on your textual data as part of the flow. The R-script generates output in a tabular format containing the words used and associated frequency. This tabular output can either be saved as dataset or exported/downloaded to excel and can be used as part of Dataflow.

Below are the steps to deploy:

1) Install Advanced Analytics feature in Oracle DV by clicking on the below icon. This will install Oracle R deployment. Alternatively you can install Advanced Analytics by running install_advanced_analytics.cmd present in <DV_INSTALL_DIRECTORY>


2) If not installed "tm" R-Package already, Please install it using following instructions:
     Open R console(double click Rgui.exe present in <Advanced_Analytics_Install_Dir>\bin\x64),
     install arules Package.
     Following are the R-commands to install:
     Set Proxy:
        $ Sys.setenv(http_proxy="<your_proxy_host>:<port_number>")
           set proxy appropriate to your network config.
     Install Package:
        $ install.packages("tm")
3) Download Term_Frequency_Analysis_V1.zip from from OracleBI Public store and unzip it.
4) Copy R.TermFrequency.xml to <DV_INSTALL_DIRECTORY>\OracleBI1\bifoundation\advanced_analytics\script_repository
5) Import the .dva project to Oracle DV. Password for the .dva is Admin123

Here is a snapshot:

Are you an Oracle Analytics customer or user?

We want to hear your story!

Please voice your experience and provide feedback with a quick product review for Oracle Analytics Cloud!
 

Friday, December 9, 2016

Daum Map Plugin is now available on Oracle BI Public Store

Daum Map plug-in for Oracle DV is now available for download on Oracle BI Public Store. Daum map provider has detailed maps exclusively for Korean geographic region. For other regions map may not render at all.

This plugin-in viz  automatically groups and renders densely packed point features based on proximity (clustering feature). Points clustered within a specified distance (in pixels) are grouped and displayed using a circle marker with a count. This plugin also displays details (metric value, label name) on hovering on the points.

Here are few screenshots of map rendered using this plug-in:


Are you an Oracle Analytics customer or user?

We want to hear your story!

Please voice your experience and provide feedback with a quick product review for Oracle Analytics Cloud!
 

Sunday, December 4, 2016

Cluster Map Plugin is now available on Oracle BI Public Store

Cluster Map plugin for OracleDV displays lat-long locations on a map (along with its associated metrics and attributes). This plugin automatically groups and renders densely packed point features based on proximity. Points that are clustered within a specified distance (in pixels) are grouped and displayed using a circle marker with a count. Icing on the cake is that you have a host of background map choices (see list below). With Cluster Map plugin, now users can get a good bird’s-eye view of the entire map without making the map look cluttered. Download it from Oracle BI Public Store.

Here is the list of features of Cluster Map plugin:

       - Auto Clustering of Points
       - Choice of background maps
           - Open Street Map
           - Google Map (Satellite, Road, etc)
           - Oracle Map
           - Carto Positron Map
           - Carto Dark Map
           - Mapbox (requires map access key)
      - Map Wrap Around or Repeat Background
      - Auto-zoom to displayed theme

Here is a screen shot of how the Cluster map looks like:


Are you an Oracle Analytics customer or user?

We want to hear your story!

Please voice your experience and provide feedback with a quick product review for Oracle Analytics Cloud!
 

Custom Points Map Plugin gets a boost in functionality

Custom Points Maps plugin allowed you to display your location data in multiple interesting ways on top of map backgrounds like Google Maps, Oracle Maps and Open Street Maps.

There are exciting new improvements to this plugin, for example with the new version more Background Map options are available. In addition to the existing Background Maps now you can use Mapbox Light, Carto Positron, Carto Dark background maps. It can now display attribute labels as well. Download it from Oracle BI Public Store.

Here is the list of all capabilities of the plugin. New capabilities added in this update are marked with *
- Choice of background maps
    - Open Street Map
    - Google Map (Road, Satellite, Shaded, Hybrid)
    - Oracle Map
    - *Carto Positron
    - *Carto Dark
    - *Mapbox (requires map access key)

- Image Markers
    - Using local icons
    - Using base64 encoded icon image
    - Using a web URL
- Map Wrap Around or Repeat Background
- Auto zoom to displayed theme
- Feature Animation (Pulse)
- *Labels and Metrics support in Info window
- *Few other styling updates


Here is a snapshot depicting the new capabilities of the plugin:


Here is the video: ** Please note that this video is recorded using previous version of the plugin, so not all the new features described above are demonstrated in this video.


Are you an Oracle Analytics customer or user?

We want to hear your story!

Please voice your experience and provide feedback with a quick product review for Oracle Analytics Cloud!